This tutorial will try to answer the following questions:
-
How many unique Get It Done requests were there in 2025?
-
How many have been closed?
Getting the right data
First, navigate to the Get It Done data dataset. The dataset includes one very large file of all reports and multiple smaller pre-filtered views to download. For this analysis, it will be more efficient to download pre-filtered views.
When selecting views, keep in mind that views in the same series can be combined. Views from different series cannot be combined without some reports being included more than once and possibly getting double-counted. {.text-bg-info}
Reports from 2025 may still be open today, and reports from 2025 may have been closed in 2025 or 2026 (or future years). The download list for this analysis includes:
Combine the data using Excel
In Excel, the Power Query feature can combine these three separate files and even clean and enhance the data.
Here are the steps:
-
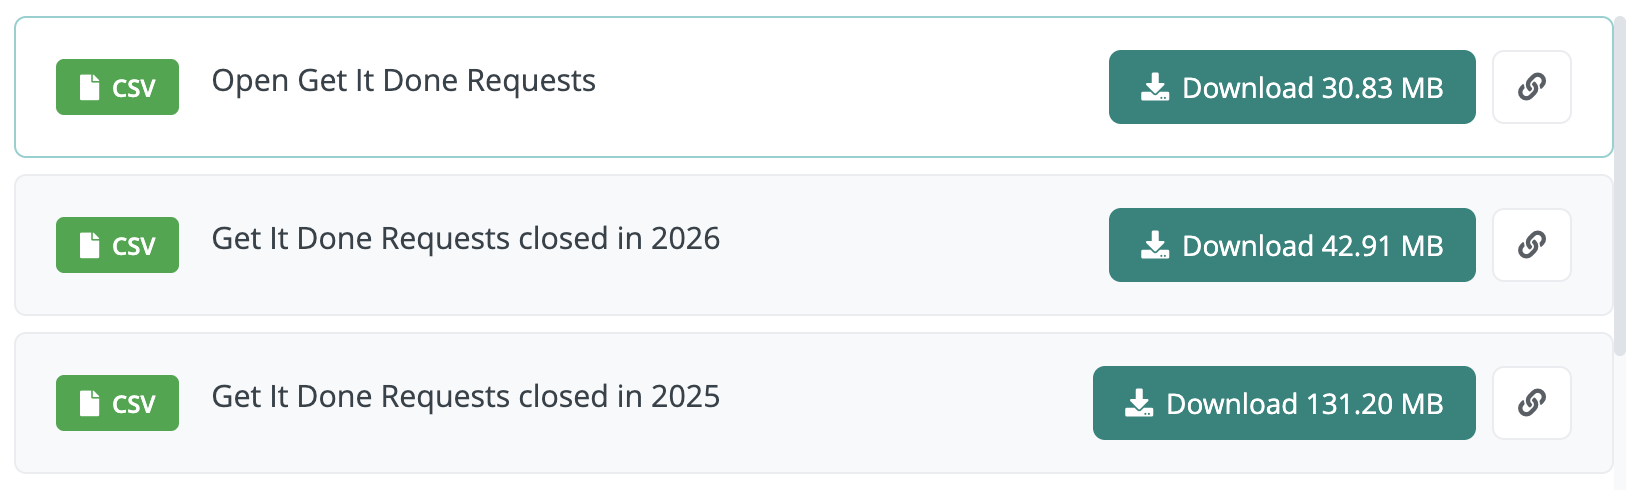
Download each of the following three files from the “Download Data” section of the Get It Done dataset page:
- Open Get It Done Requests
- Get It Done Requests closed in 2026
- Get It Done Requests closed in 2025
-
Put all of the files together in a folder
-
Open a blank Excel workbook. Click “Data” in the top horizontal menu. Next, click the “Get Data” button in the ribbon, and choose From File > From Folder
-
In the “Browse” box that pops up, navigate your computer directory to find the folder you created in Step 2. Click “Open”
-
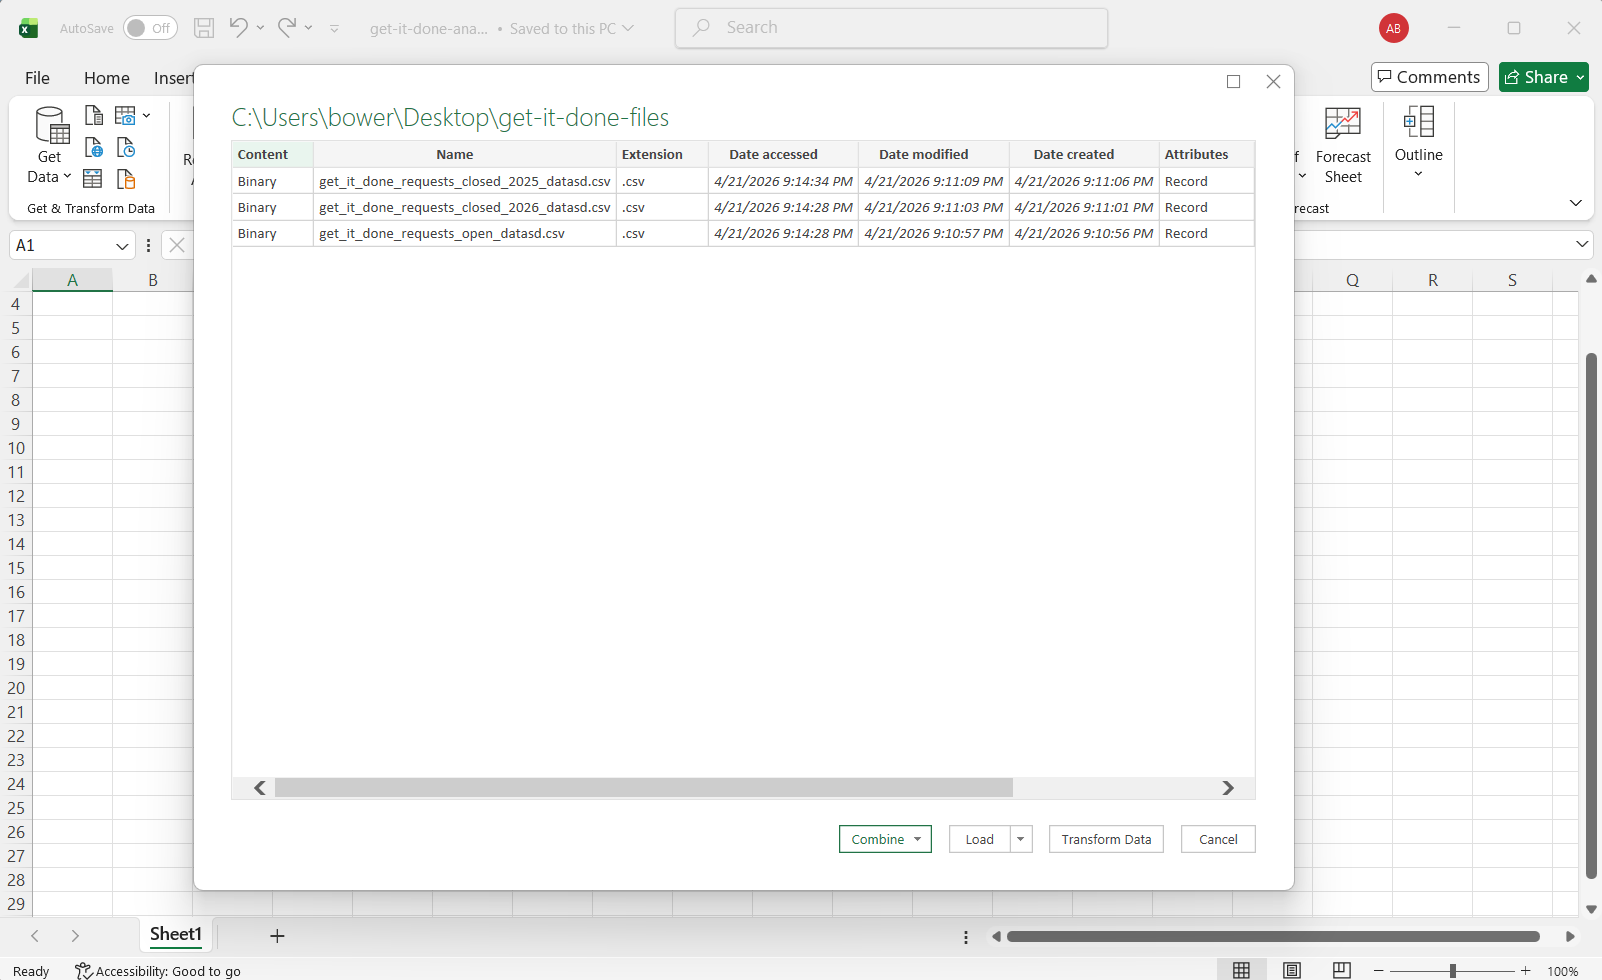
A new box pops up. The top of this box should display the path to the folder on your computer. Below should be a table that includes each of the files you downloaded in Step 1. At the bottom of the box, click the dropdown arrow in the “Combine” button, and choose “Combine & Transform Data”
-
The “Combine Files” box pops up. The purpose of this box is to configure a few settings Excel will need for combining the data. The default options will work, so just click “OK” without making any changes. Now, Excel will open the Power Query Editor. The editor offers the ability to transform the data, such as changing the data type of a column, removing columns, and adding columns. Applying some transformations will make loading and analyzing the data easier.
-
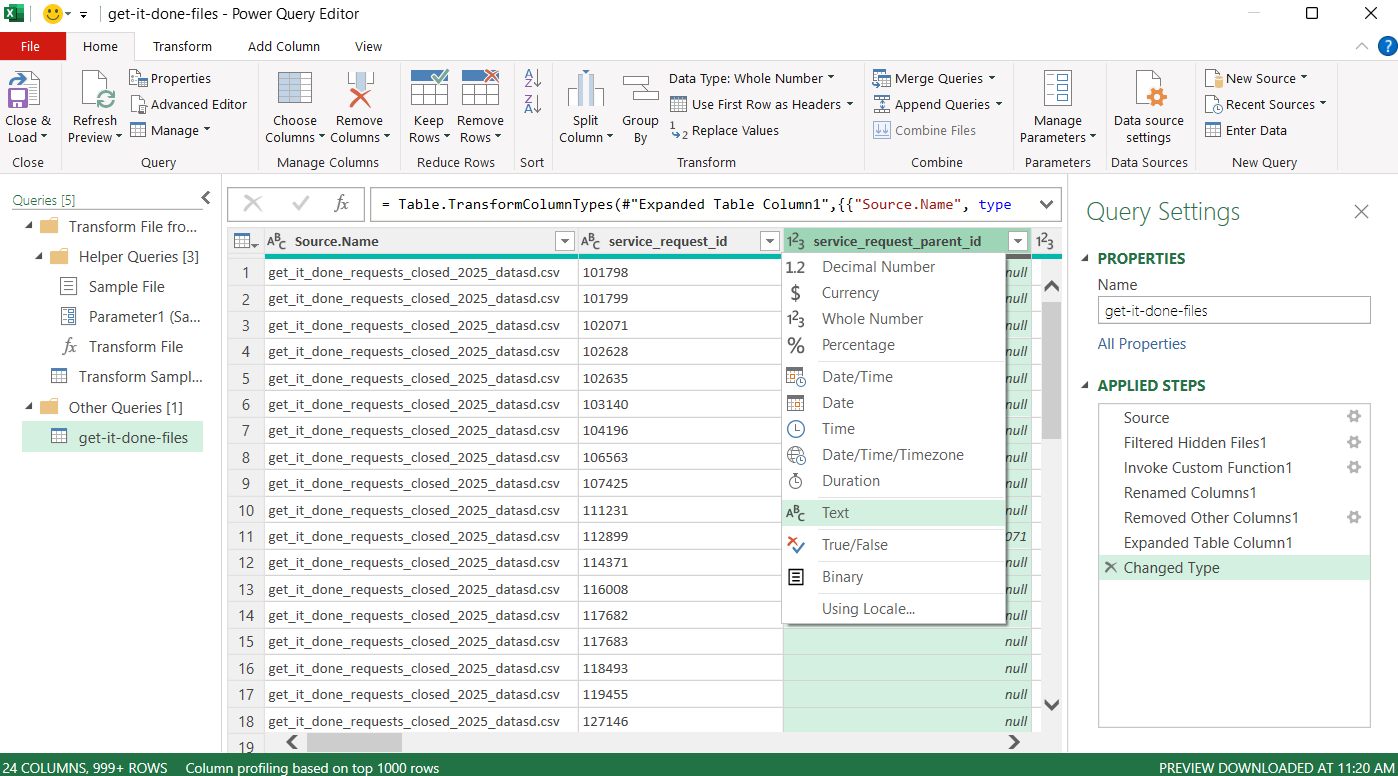
The first recommended transformation is to change the data type of
service_request_idandservice_request_parent_idfrom Number to Text. These are system-generated numeric identifiers and there is no need to perform math operations on these columns. Additionally, errors occurred when trying to read them in as numbers because of data quality issues. To change the data type, click the data type icon to the left of the column name, and select “Text” from the dropdown.
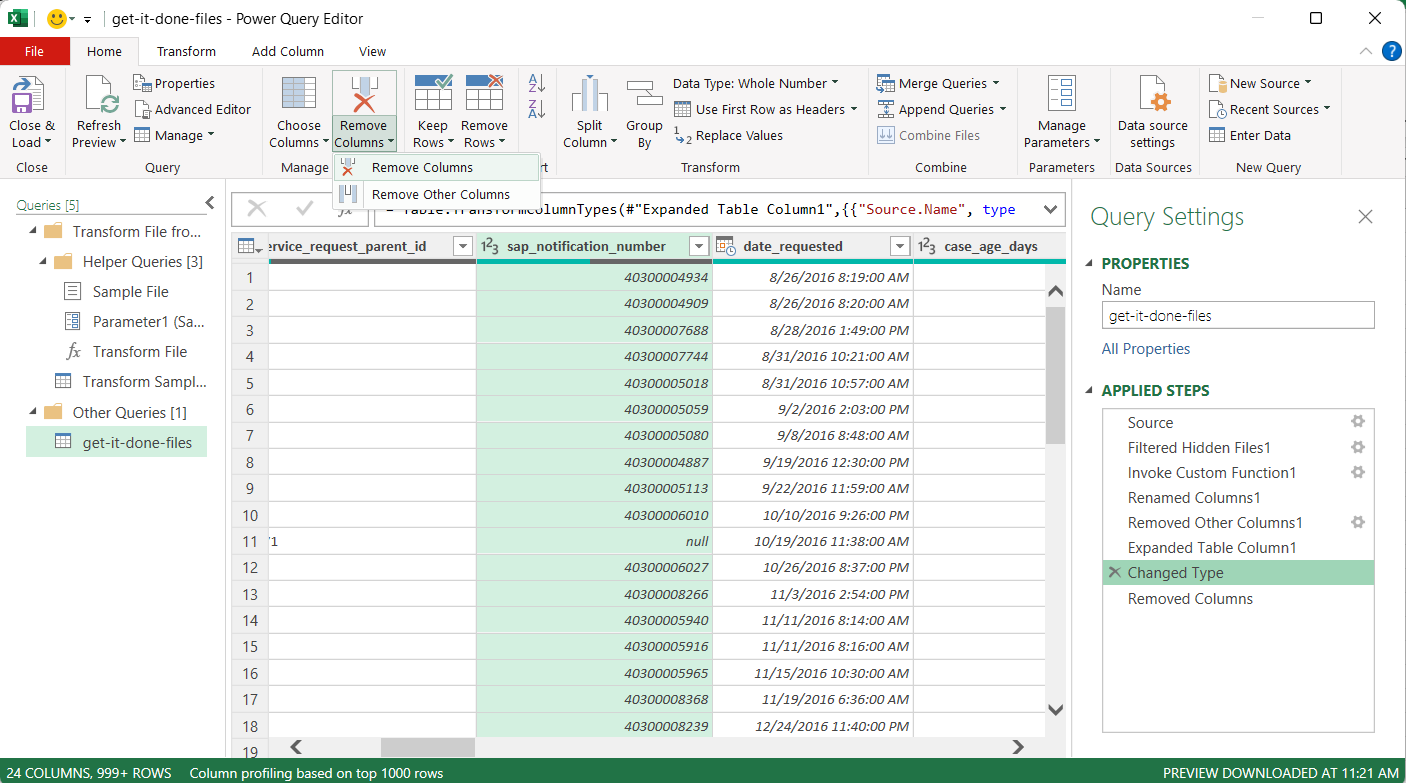
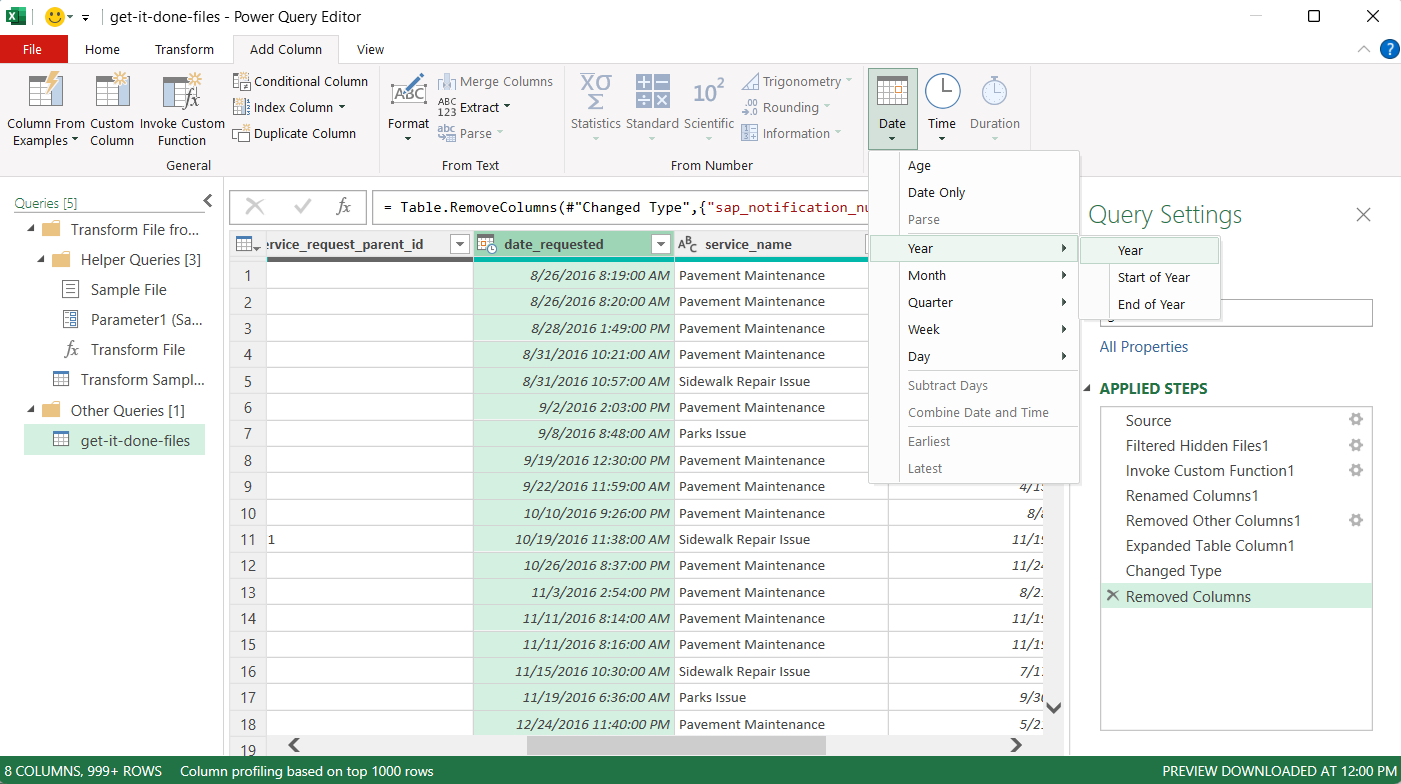
- Next, remove unneeded columns. Not only does this reduce the chance of data type errors, but it makes the data smaller and easier to analyze. Click the column header to select the column. Next, click the “Remove Columns” button from the top ribbon, and select “Remove Columns” from the dropdown. For this tutorial, it is safe to remove
- Finally, to help count reports by year, add a new column with the year of the date requested. Select “Add column” in the horizontal menu across the top. Click the header for the “date_requested” column to select it. Once this column is selected, click the “Date” button in the ribbon above and choose year from the dropdown menu. This will extract the year of the date requested into a new column.
- Click back to “Home” on the horizontal top menu, and then click “Close & Load” button on the far right.
The combined data should now be loaded into one Excel sheet!
Combine the data using Python
In the “Download Data” section of the Get It Done dataset page, click the link button to copy the URL for each view you want to read into your Python script.
import pandas as pd

# Read in closed in 2025
gid_closed_2025 = pd.read_csv('https://seshat.datasd.org/get_it_done_reports/get_it_done_requests_closed_2025_datasd.csv',low_memory=False)

# Read in closed in 2026
gid_closed_2026 = pd.read_csv('https://seshat.datasd.org/get_it_done_reports/get_it_done_requests_closed_2026_datasd.csv',low_memory=False)

# Read in open
gid_open = pd.read_csv('https://seshat.datasd.org/get_it_done_reports/get_it_done_requests_open_datasd.csv',low_memory=False)

# Combine
gid_combined = pd.concat([gid_closed_2025,gid_closed_2026,gid_open])

# Count total number of reports
gid_combined['service_request'].nunique()
Deduplicating the combined data
After combining all three datasets, count the unique identifier, service_request_id. The data includes more than half a million reports that are open or were closed in 2025 or 2026 to-date.
However, A lot of reports are duplicates where someone submitted a Get It Done report for the same issue that someone else has already submitted. The service_request_parent_id links a duplicate with the original and can be used to filter reports to get just one report per problem.
Deduplicating with Excel
To explore data in Excel, this tutorial recommends using Pivot Tables. Pivot tables allow you to aggregate data and perform calculations simply by dragging and dropping.
To get started, click “Insert” from the horizontal menu at the top, then click the “PivotTable” button. A box will pop up with some configuration options. The default options will work fine, so click “OK”. Excel will open a new Sheet with the PivotTable Fields sidebar open on the right of the screen. This sidebar will show a list of the columns (“Fields”) at the top and four boxes at the bottom into which the columns can be dragged and dropped.
First, drag service_request_id to the Values box. The column/field becomes a dropdown that, when clicked, opens a box with options for various calculations. For this tutorial, use “Count”. Next, drag service_request_parent_id to the Filters box. This creates a dropdown at the top of the Sheet for that field. The dropdown contains the top 10,000 values from the column, as well as an option for blank, or empty. Choose the option for blank or empty. (If that option is not displayed, try unselecting the All/Select All option).
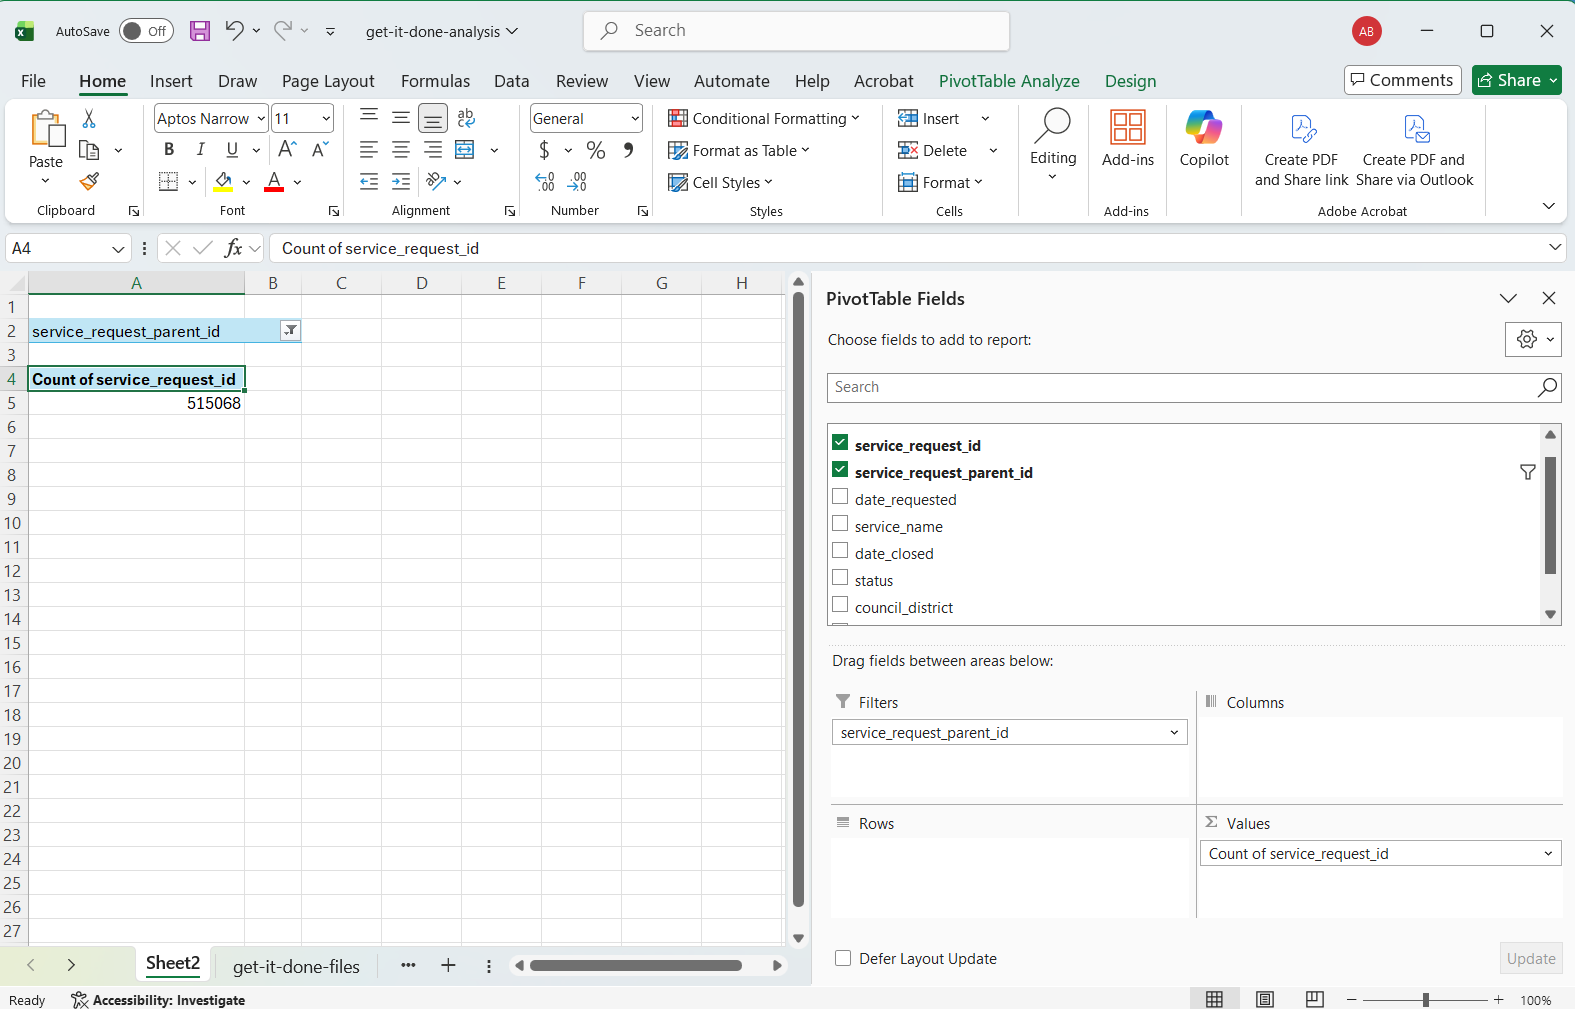
The Count showing in the sheet should update once the filter is applied.
Deduplicating with Python
# Remove duplicate requests
gid_combined_no_dupes = gid_combined[gid_combined['service_request_parent_id'].isna()]

# Count total number of reports again from the deduplicated data
gid_combined_no_dupes['service_request'].nunique()
Filter for 2025
Now that the data contains just unique reports, the next step is to filter out reports submitted during a year other than 2025. This is necessary because the three data files downloaded contain reports by status, not by the date they were submitted. All of them can contain reports submitted in years other than 2025.
Filtering with Excel
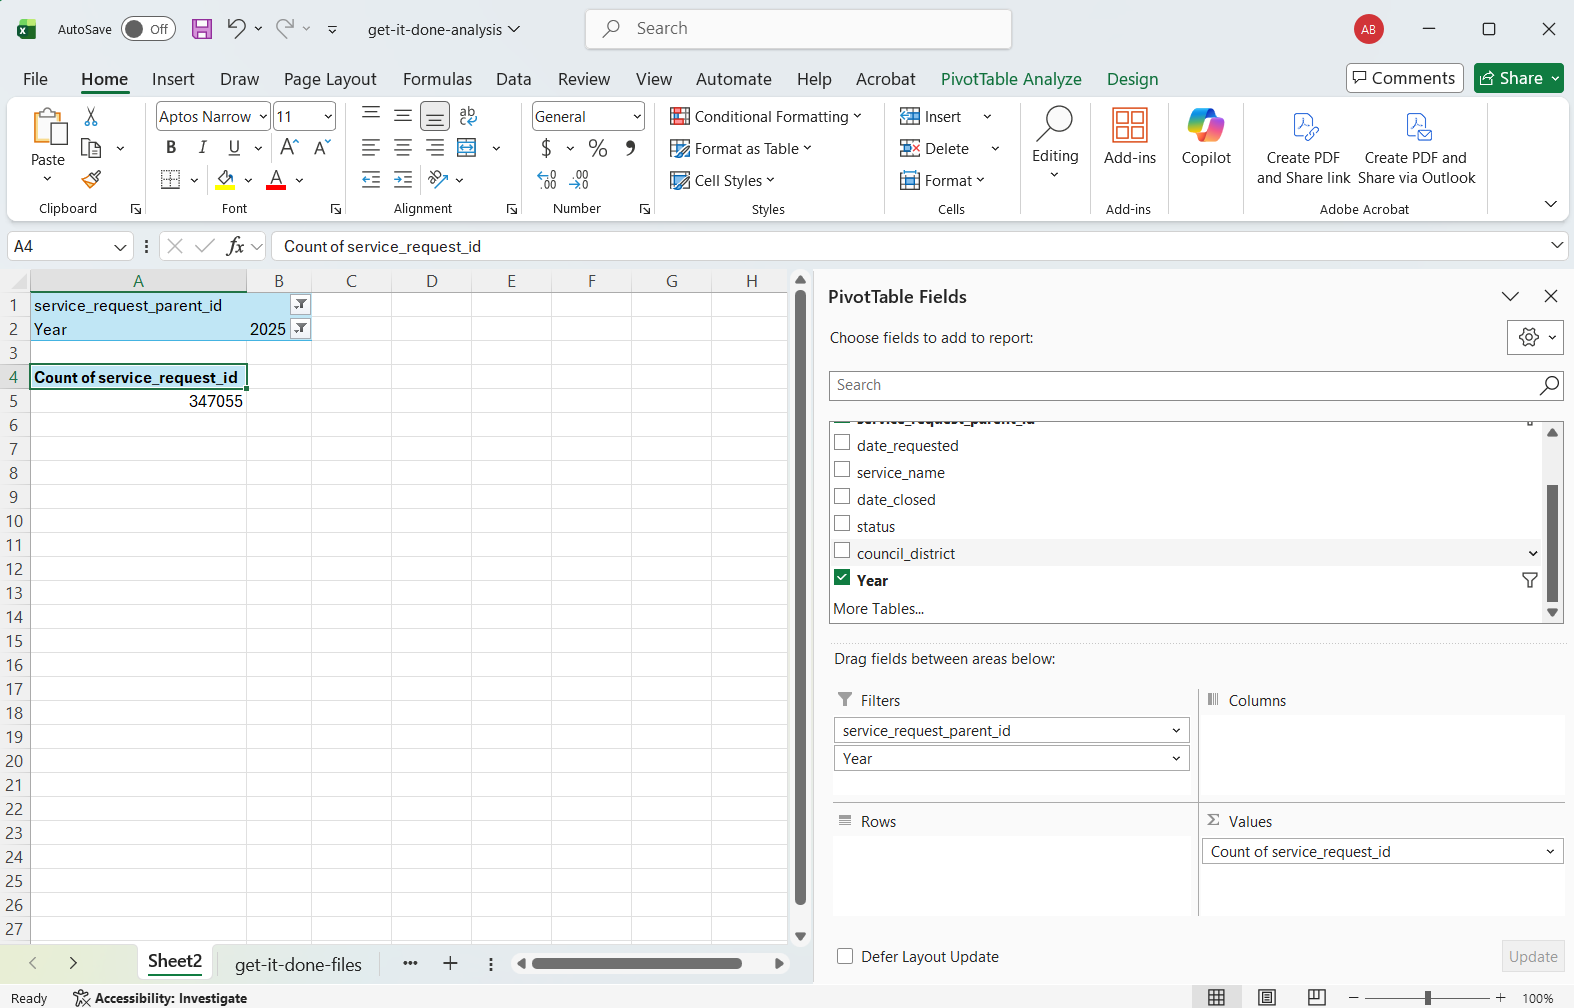
Continuing with same Pivot Table created while deduplicating, the next step is to drag the Year column to the Filter box. The Year column was created in Step 9 of the Combine Data with Excel section by extracting the year from the date_requested column. As before, adding Year to the Filter box generates a Year dropdown at the top of the main Sheet, directly underneath the filter for service_request_parent_id. Expand the dropdown and select 2025.
Filtering with Python
# Select only reports submitted in 2025
gid_requested_2025 = gid_combined_no_dupes[gid_combined_no_dupes['date_requested'].dt.year == 2025]
gid_requested_2025['service_request'].nunique()
Count reports by status
Now that the dataset is filtered down to just unique reports submitted in 2025, the analysis can focus on what happened to those reports.
Aggregating with Excel
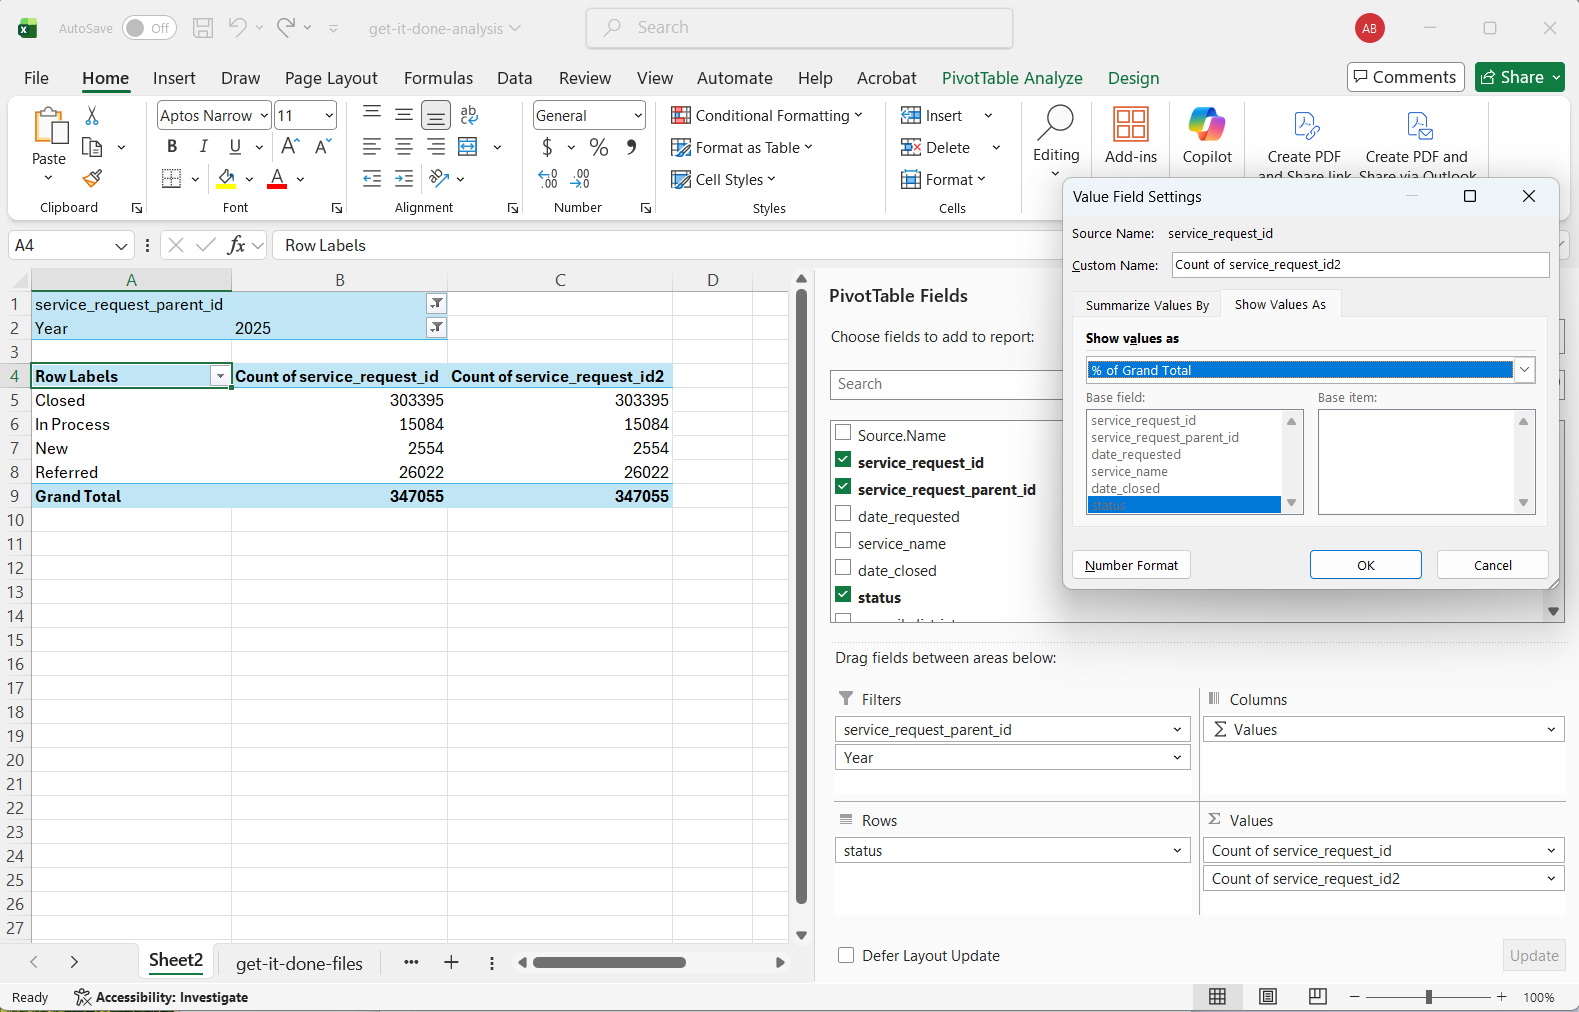
Again continuing with the same Pivot Table, drag the status field to the Rows box. Now, instead of one overall count, the count will be by status. To learn more about what these statuses mean, check out the data dictionary on the Get It Done data dataset page.
Percentage of total by status might be a more meaningful metric than the basic count. To get this calculation, drag the service_request_id field to the Values box for a second time. Click the dropdown that now appears in the Values box (it is likely labeled as “Count of service_request_id2”). A dialog box will pop up with options for calculations. For “Custom name”, change the name to something description, like “Percent of total reports”. Directly underneath the “Custom name” option, click the tab for “Show Values As”. Click to expand the “Show Values As” dropdown, and choose “% of Grand Total”. The second column in the pivot table will now have a percentage to go along with the count.
Aggregating with Python
# Calculate the count of reports per status
gid_requested_2025.groupby('status')['service_request_id'].value_counts()

# Calculate percentage of total
gid_requested_2025.groupby('status')['service_request_id'].value_counts(normalize=True)
Assessing the final insights
The analysis showed that, for 2025, the City closed 87 percent of the reports it received within the year and referred another 7.5 percent. About 4 percent are still in progress today. From here, it could be interesting to look more closely at In Progress reports, perhaps by service_name, which is a category for the type of report.