This tutorial will answer the question of:
- How many vehicle-related citations have there been from 2015 to 2025?
The analysis will examine both parking citations and moving violations.
Parking Citations
First, get the parking citation data for 2015 to 2025. This data can be accessed from the Parking Citations dataset. The time period for this analysis will require downloading more than 20 files. This is because the data are split up into one file for every six months.
The files all need to be processed combined into a single Pandas dataframe. The combined data has more than 5.2M parking citations from 2015 to 2025.
import pandas as pd

# Read all the parking citation datasets
file_pattern = 'parking_citations*'

list_of_files = glob.glob(file_pattern)

list_of_dfs = []
for filename in list_of_files:
    data = pd.read_csv(filename, low_memory=False)
    list_of_dfs.append(data)

# Combine
parking_violations_2015_2025 = pd.concat(list_of_dfs, ignore_index=True)

# Count total number of reports
parking_violations_2015_2025.shape
Moving Violations (2015 - June 2018)
For traffic violations pre-July 2018, first get the data from the vehicle stops datasets.
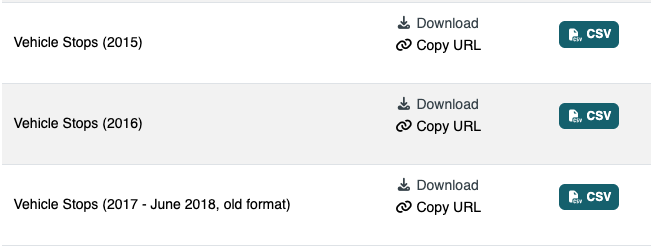
Next, combine the files just like with the parking violations. Finally, subset for only moving violations because that is the focus of the analysis. After subsetting, there are about 240k traffic violations from 2015 to June 2018.
import pandas as pd

# Read all the vehicle stops datasets
vehicle_stops_2015_path = 'vehicle_stops_2015_datasd.csv'
vehicle_stops_2015 = pd.read_csv(vehicle_stops_2015_path)

vehicle_stops_2016_path = 'vehicle_stops_2016_datasd.csv'
vehicle_stops_2016 = pd.read_csv(vehicle_stops_2016_path)

vehicle_stops_2017_path = 'vehicle_stops_2017_datasd.csv'
vehicle_stops_2017 = pd.read_csv(vehicle_stops_2017_path)

# Combine and filter for moving violations
vehicle_stops_2015_2018 = pd.concat([vehicle_stops_2015, vehicle_stops_2016, vehicle_stops_2017])
traffic_violations_2015_2018 = vehicle_stops_2015_2018[vehicle_stops_2015_2018['stop_cause'] == 'Moving Violation']

# Count total number of reports
traffic_violations_2015_2018.shape
Moving Violations (July 2018 – 2025)
Moving violations post-June 2018 are included with the Police Racial and Identity Profiling Act (RIPA) data. The historic and present data for both the RIPA-basic details and RIPA-reason for stop datasets will both be needed for the analysis.
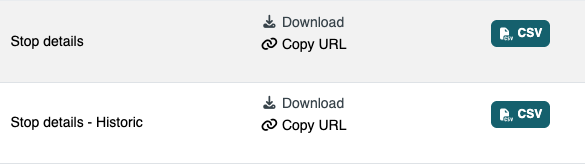
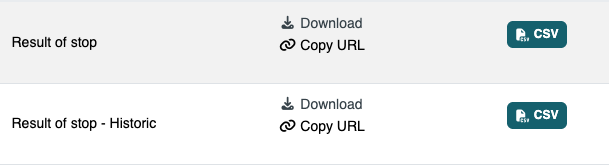
First, join the basic details and reason for stop data for both the present and historic data.
import pandas as pd

# Read all the RIPA datasets
ripa_path = 'ripa_stops_datasd.csv'
ripa = pd.read_csv(ripa_path, low_memory=False)

ripa_historic_path = 'ripa_stops_historic.csv'
ripa_historic = pd.read_csv(ripa_historic_path, low_memory=False)

ripa_stop_path = 'ripa_stop_reason_datasd.csv'
ripa_stop = pd.read_csv(ripa_stop_path, low_memory=False)

ripa_historic_stop_path = 'ripa_stop_reason_historic.csv'
ripa_historic_stop = pd.read_csv(ripa_historic_stop_path, low_memory=False)

# Combine
ripa = ripa.merge(ripa_stop, how='left', on=['UID', 'ID', 'PID'])
ripa_historic = ripa_historic.merge(ripa_historic_stop, how='left', on=['uid', 'stop_id', 'pid'])
The RIPA data will contain “duplicates” of the same stop. The “duplicate” rows account for additional people present at the stop (i.e. a passenger in the vehicle for a traffic stop). Only the number of stops, and not the number of people that are present at a stop, is important, so “duplicates” will be removed. Additionally, the column names don’t match perfectly between the historic and current data, so the column names are changed to match before combining the historic and current data into a single dataframe.
# Remove "duplicates"
ripa = ripa.drop_duplicates(subset='UID')
ripa_historic = ripa_historic.drop_duplicates(subset=['uid'])

# Match column names and combine
ripa.columns = ripa.columns.str.lower()
column_mapping = {'id': 'stop_id', 'expyears': 'exp_years', 'stopdate': 'date_stop', 'stoptime': 'time_stop',
                  'stopinresponsetocfs': 'stop_in_response_to_cfs', 'officerassignmentkey': 'officer_assignment_key',
                  'block': 'address_block', 'landmark': 'land_mark', 'street': 'address_street',
                  'highwayexit': 'highway_exit', 'schoolname': 'school_name', 'perceivedlimitedenglish': 'perceived_limited_english',
                  'perceivedage': 'perceived_age', 'perceivedgender': 'perceived_gender', 'cityname': 'address_city',
                  'beatname': 'beat_name', 'reasonforstop': 'reason_for_stop', 'reasonforstopcode': 'reason_for_stopcode',
                  'reasonforstopcodetext': 'reason_for_stop_code_text', 'reasonforstopexplanation': 'reason_for_stop_explanation',
                  'reasonforstopdetail': 'reason_for_stop_detail'}
ripa.rename(columns=column_mapping, inplace=True)
ripa_combined = pd.concat([ripa, ripa_historic])
Next, clean up the dates and times so that they are in the same format, and remove the rows that occurred after 2025.
# Format dates and times
ripa_combined['date_stop'] = pd.to_datetime(ripa_combined['date_stop'], format='mixed', errors='coerce').dt.date
ripa_combined['time_stop'] = pd.to_datetime(ripa_combined['time_stop'], format='mixed', errors='coerce').dt.time

# Filter
ripa_combined = ripa_combined[ripa_combined['date_stop'] < dt.datetime.strptime('2026-01-01', '%Y-%m-%d').date()]
Finally, subset for just moving violations. From July 2018 to 2025, there were over 280k moving violations.
# Filter
traffic_violations_2018_present = ripa_combined[ripa_combined['reason_for_stop_detail'] == 'Moving Violation'].copy()

# Count total number of reports
traffic_violations_2018_present.shape
There were a combined 523,858 moving violations from 2015-2025 and 5,254,498 parking violations during the same time period.